Why Traffic Jams Happen From Nothing: The Physics and the Fixes
Traffic that stops for no reason isn't a mystery and isn't your imagination - it's a wave, and the Federal Highway Administration has a name for it. Here's the mechanism that makes a road tip over, and what actually pushes it back.
Evergreen explainer, checked against the primary sources listed below. Full disclaimer
On this page7 sections
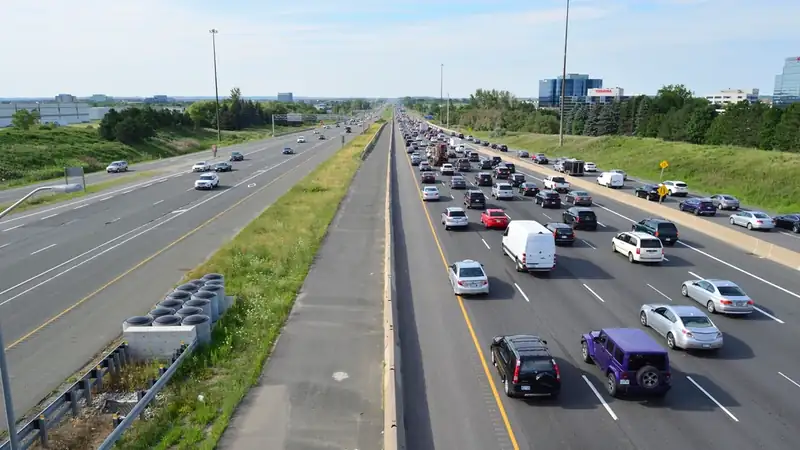
You've been in one. Traffic slows, stops, crawls for four minutes, and then — without a crash, a lane closure, a police car, or any other visible reason — opens back up to seventy. Everyone looks around for the cause. There isn't one to find, because whatever started it happened well ahead of you, some minutes ago, and has already dissolved.
The Federal Highway Administration calls this a phantom traffic jam, and its own bottleneck primer describes the mechanism almost conversationally: "It only takes one driver breaking the chain to cause the car-following to brake, and that in turn causes the inevitable reverberation and rippling down the line, eventually leading to full stop-and-go." That is a physical claim, and it has a physics behind it that is genuinely satisfying once you have it — because it explains not just the jam, but why the obvious fixes work about half as well as people expect.
The scale is not trivial. The Texas A&M Transportation Institute's 2025 Urban Mobility Report put U.S. congestion at 9.8 billion hours of delay and $269 billion in cost for 2024, with the average commuter losing 63 hours — the highest per-commuter figure the series has measured.
The curve every road lives on
Start with the only equation you need. Flow — the number of vehicles passing a point per hour — is speed multiplied by density, the number of vehicles per mile of lane. FHWA's traffic flow theory monograph states it as q = u × k, and the entire behavior of a highway follows from what happens to those three quantities as traffic builds.
At low density, adding cars adds flow and barely touches speed. Everyone has room; nobody is constrained by anybody. Push density higher and drivers begin adjusting to each other — closing up, matching pace — and speed starts to slide. Flow keeps rising anyway, because more cars are on the road even though each is slower.
Then comes the turn. At some critical density, the speed loss starts outrunning the density gain, and flow peaks. That peak is the road's capacity. Push past it and flow falls: more cars on the pavement, fewer cars per hour getting anywhere. At the far end, jam density, everything is stopped and flow is zero.
The curve that explains the whole thing
Flow against density on a single freeway lane, in schematic form
Diagram: The Explainer Desk, drawn to illustrate the flow-density relationship. Source: FHWA, Traffic Flow Theory: A State-of-the-Art Report, chapter on traffic stream characteristics
Notice the two marked points. They sit at the same height — identical flow, identical cars-per-hour on a traffic counter — but on opposite branches of the curve. One is a road running at speed with gaps between vehicles. The other is a crawl. A count alone can't tell them apart, which is why traffic engineers care about speed and occupancy rather than volume, and why "this road carries 1,800 vehicles an hour" tells you nothing about whether driving it is pleasant.
Why the jam moves backward
The curve explains capacity. It doesn't yet explain the phantom. For that you need one more ingredient: a driver's response to the car ahead is delayed, and it is not symmetric.
Braking is fast and decisive; re-accelerating is slow and cautious. When the car ahead of you slows by 5 mph, you don't slow by 5 — you slow by 7 or 8, because you're reacting after a delay and covering for uncertainty. The driver behind you overshoots your overshoot. Ten cars back, someone is stopped.
Meanwhile the disturbance itself is traveling. Each driver's brake light comes on slightly later and slightly farther back than the last one's, so the cluster of slow cars propagates upstream, against the direction of travel, while every individual car continues forward through it and out the front. That is why it has no cause where you find it: you meet the jam where it has arrived, not where it began.
The cars move forward. The jam moves backward. You drive into it, through it, and out of it, and it is still there behind you, drifting upstream, looking for its next victim.
Three ingredients, then: density near the critical point, a perturbation, and reaction lag. Only the first is under anyone's control.
What actually causes the perturbation
The perturbation can be almost anything — a lane change, a merge, a truck on a grade, a driver looking at a phone. But most delay is not distributed randomly across the network. FHWA's national composite estimate, published in 2004 and still the standard framing the agency uses, apportions congestion across six sources.
Where the delay comes from
FHWA national composite estimate of the sources of congestion, share of total (2004)
Source: FHWA, Traffic Congestion and Reliability: Linking Solutions to Problems (2004) — a national average; the mix varies substantially by corridor.
The largest slice, bottlenecks, is a physical location where capacity narrows: a lane drop, a tight curve, a merge, a grade. FHWA defines one as a localized section that experiences reduced speeds and delays from a recurring operational influence or a nonrecurring event. Bottlenecks matter because they're where density crosses the critical line first and most reliably. The wave forms there and then travels upstream into road that was, physically, perfectly fine.
That is the same diagnostic logic that shows up wherever a network has a pinch point — at a container terminal, the binding constraint is water-side, yard-side, or land-side, and adding capacity to the wrong one accomplishes nothing. On a freeway, widening a stretch upstream of a lane drop delivers more cars to the drop, faster.
The experiment that switched a fix off
The cleanest American evidence about all of this comes from an unusual source: a state that was ordered to turn its traffic management off and measure what happened.
The Twin Cities had run one of the country's most aggressive ramp metering systems — signals on freeway on-ramps that release vehicles one or two at a time. In late 2000, under legislative direction, Minnesota's transportation department shut the meters down for several weeks and studied the result.
What happened when the meters went dark
Twin Cities freeways, peak periods, with ramp meters off versus on (2000-01 evaluation)
Source: Minnesota Department of Transportation, Twin Cities Ramp Meter Evaluation - Final Report (2001)
With the meters off, peak mainline throughput fell by an average of 14%. Freeway speeds dropped roughly 7 mph across the peak period and 18 mph in the peak hour, which worked out to about 22% more travel time on the test segments. Travel time became almost twice as unpredictable. Peak-period crashes on metered freeways and ramps rose 26%.
That combination — fewer cars per hour and slower speeds — is the fundamental diagram's right-hand branch in the wild. The meters were not restricting traffic for its own sake. They were keeping mainline density below the critical point, and holding the freeway on the good side of its own curve.
FHWA describes the mechanism as two jobs at once: metering breaks up the platoons of vehicles that arrive together at a merge, so mainline drivers don't have to brake for a cluster, and it manages total entry demand to a level near capacity, which prevents breakdown. The cost is real and lands on a specific group — a wait at the ramp, measured in the Twin Cities at about 2.3 minutes per vehicle in the peak. Whether that trade is worth it is a legitimate policy argument, and it's the argument that produced the shutdown study in the first place.
Fixes aimed at the wave itself
Metering manages density. A newer family of tools targets the amplification directly.
Speed harmonization posts a reduced, variable speed limit upstream of a forming queue. It sounds counterproductive — slowing traffic to speed it up — but it works on the wave: arriving at 50 into a queue means a gentle deceleration rather than a hard brake, and a gentle deceleration is not amplified into a stop.
Smarter following. Because the amplifier runs on overreaction, a vehicle that maintains a steady gap and resists sharp braking absorbs a disturbance instead of passing it on. This is the premise the CIRCLES consortium tested on Interstate 24 outside Nashville in November 2022, funded by the National Science Foundation and the Department of Energy, by releasing a fleet of cars running wave-damping cruise-control software into ordinary morning traffic to see whether a small share of smoother vehicles could smooth the stream around them — the project's stated target was 10% or better energy savings.
Faster incident clearing. Since incidents are a quarter of delay in FHWA's estimate, and since a blocked lane pushes a road across the critical density immediately, minutes saved in clearing a crash are worth more than they look.
The fix that behaves unexpectedly
Then there's adding lanes, which is where the evidence is most argued over and where it pays to be careful.
Economists Gilles Duranton and Matthew Turner examined U.S. metropolitan areas and found that vehicle-kilometers traveled increase roughly in proportion to lane-kilometers of interstate highway — an elasticity near one. Their explanation has three parts: existing residents drive more, freight and commercial activity expand, and people and firms move in. Their conclusion, stated plainly, was that increased provision of roads or public transit is unlikely to relieve congestion.
The honest summary is that lane capacity reliably buys throughput and unreliably buys speed, and that the interstate network's history is full of both outcomes.
What one driver can do
Here's the part that's actually actionable, and it follows straight from the mechanism rather than from etiquette.
None of that clears a bottleneck. But the phantom jam isn't caused by a bottleneck. It's caused by a road being right at the edge of its curve and a few hundred people reacting slightly too late — and that one, unusually among traffic problems, has a per-driver answer.
Primary Sources
- FHWA, Traffic Congestion and Reliability: Linking Solutions to Problems (2004)
- FHWA, Recurring Traffic Bottlenecks: A Primer, Fourth Edition (2017)
- FHWA, Traffic Flow Theory: A State-of-the-Art Report
- Minnesota Department of Transportation, Twin Cities Ramp Meter Evaluation - Final Report (2001)
- Gilles Duranton and Matthew A. Turner, The Fundamental Law of Road Congestion, NBER Working Paper 15376
- Texas A&M Transportation Institute, Urban Mobility Report (2025 edition)
Keep explaining: related from the desk
The Interstate Highway System
It's 1.2% of American road miles carrying about a quarter of all driving. Here's the machine behind the interstates — the 90/10 funding deal, the Highway Trust Fund, and how one 1956 law rearranged where Americans live, shop, and work.
Why US Cities Can't Just Build More Trains
New York's newest subway cost roughly $2.95 billion per mile — against a global average near $350 million. An anatomy of where the money actually goes: stations, consultants, process, and time.
How Ports Work
A container port isn't one system, it's six - paperwork, berth, crane, stack, gate, and the rail or truck that finishes the job. Following a single steel box through all of them explains what ports do to prices and, just as usefully, what they don't.