How Ports Work: The Container Journey That Sets Shelf Prices
A container port isn't one system, it's six - paperwork, berth, crane, stack, gate, and the rail or truck that finishes the job. Following a single steel box through all of them explains what ports do to prices and, just as usefully, what they don't.
Evergreen explainer, checked against the primary sources listed below. Full disclaimer
On this page7 sections
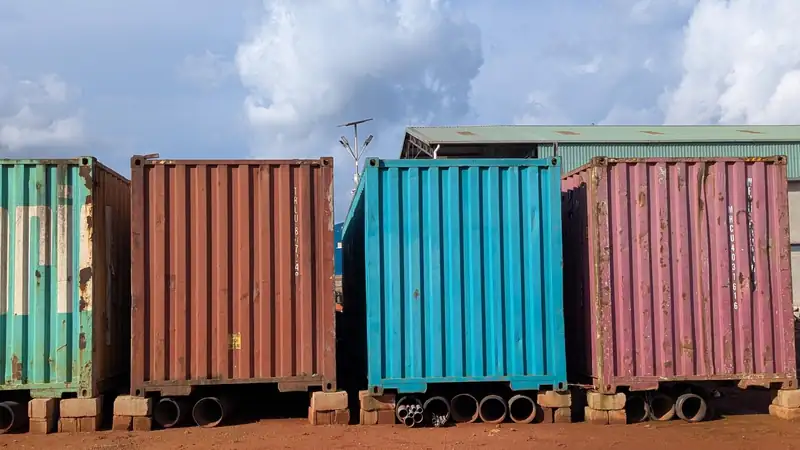
Stacked somewhere on the Pacific right now, nine boxes high on a ship longer than three football fields, is a corrugated steel container about the size of a one-car garage with your next pair of running shoes in it. Nothing about that box is clever. That is exactly the point. A shipping container is the least sophisticated object in the global economy — steel walls, a plywood floor, eight cast fittings at the corners — and its dumbness is the whole trick. Because every container shares the same corner fittings and the same handful of lengths, a crane in Asia, a slot on a ship, a railcar in Chicago, and a trailer chassis in Ohio can all grab it without anyone negotiating anything.
Ports are where that box changes hands. The handoff is not one operation but six or seven, each with a separate owner, a separate clock, and a separate way of billing somebody. Trace a single container through all of them and the import machine stops being a vague anxiety about supply chains and becomes an itinerary — with a few specific places where the money and the delays collect.
The unit everything is counted in
Port statistics run on TEUs: twenty-foot equivalent units, the volume of one 20-foot box. The 40-footer that dominates transpacific trade counts as two. It's an accounting fiction, but a useful one, and every number below uses it.
The first thing the numbers show is concentration. In 2022 — the most recent complete year in the Bureau of Transportation Statistics' port performance program as of 2026 — 110 U.S. ports handled 45.7 million loaded TEUs. The top 25 of them handled 96% of that; the top 16 handled 90%.
Three ports, two-fifths of the boxes
Loaded TEUs handled, top five U.S. container ports, 2022 (millions)
Source: Bureau of Transportation Statistics, Port Performance Freight Statistics: 2025 Annual Report
That concentration isn't sloppiness. A container terminal is a giant capital object — dredged channel, reinforced wharf, gantry cranes tall enough to see from the freeway, rail yard behind it — and it only earns back its cost at volume. Which also means a snarl at two or three facilities is felt in every state, a fragility that road networks like the interstate system don't share, because roads have thousands of redundant entrances and a deepwater berth has one.
The paperwork sails first
Long before the ship does, the data does. Under the Importer Security Filing rule — universally called "10+2," in effect since January 26, 2009 and applying to cargo arriving by vessel — the importer transmits ten data elements to U.S. Customs and Border Protection and the carrier transmits two more, keyed to that specific container, before it is loaded at the foreign port. Miss the filing and the consequences are monetary penalties, extra inspection, and delayed cargo.
The mechanism worth understanding: by the time the ship is at sea, the government already knows what's supposedly in every box and has run it through risk targeting. Physical inspection is the exception, because inspection is slow and the system's design premise is that boxes should keep moving. The customs entry that releases the cargo is typically filed while the vessel is still on the water, so the box can leave the terminal in hours rather than days.
This is the first place a "port delay" can originate without anything at the port going wrong. A misdeclared commodity, a missing document, a container flagged for exam — each strands a box in a yard where every day starts costing money, for reasons we'll get to.
The berth, where the crane is the clock
A ship arrives into a berth window negotiated weeks earlier. Cargo comes off by ship-to-shore crane, working a stowage plan fixed before departure — containers are loaded in an order that keeps the vessel stable and puts each port's boxes where they can be reached without digging. Get the plan wrong and the crane spends its shift moving other people's freight.
Everything about a terminal's layout follows from one fact: a ship at a berth earns nothing. Fuel, crew, and capital keep burning; revenue doesn't restart until it sails. So the terminal's job isn't to store cargo. It's to convert a vessel's worth of boxes into a pile on land as fast as the cranes physically allow, then push that pile out the gate.
A port is not a warehouse. It's a buffer — and buffers only work if what enters them leaves quickly.
Ship size is the pressure working against that goal. After the Panama Canal's expanded locks opened in 2016, larger vessels became routine on more U.S. routes, and ports responded by dredging deeper and buying taller cranes. But bigger ships don't smooth the work — they lump it. The same annual cargo arrives in fewer, larger bursts, and a terminal sized for the average is underwater on the peak. The BTS data shows the shape of that: from January 2023 through June 2024, average monthly vessel time at berth was consistently highest at West Coast ports and lowest at East Coast ports, running close to triple by June 2024 — largely a function of how many boxes a single transpacific call unloads, not of anyone working slower.
The stack, and the meter
Off the crane, the box goes into the yard, stacked several high by straddle carriers or rubber-tired gantries. Stacking is dense and cheap; retrieval is not. Pulling out a container buried under three others requires "rehandles," and every rehandle is a move that produces no revenue. A yard that gets too full doesn't degrade gracefully — it degrades geometrically, because the fuller it is, the more digging each retrieval takes.
That's why the yard has a meter. Each container gets a few days of free time; after that, demurrage accrues while the box sits at the marine terminal, and detention accrues when the carrier's equipment stays out beyond its allowance. These charges exist to make sitting still expensive, and they are not small in aggregate: the Federal Maritime Commission, which collects billing data from nine major ocean carriers, reports roughly $15.4 billion in detention and demurrage charges billed between April 2020 and March 2025, with quarterly billing peaking in the fourth quarter of 2024 at about 85% above its second-quarter 2020 baseline.
This is contested ground, and both sides describe the same machine accurately. To carriers and terminals, demurrage is a congestion price — the only lever that reliably clears a yard, billed mostly to whoever left boxes sitting. To importers and truckers, the meter runs during backups they cannot fix: a terminal with no appointment slots, or a chassis that isn't available, still generates charges. The FMC's billing rule, effective in 2024, addressed process rather than price — invoices within 30 days of charges being incurred, at least 30 days for the billed party to seek mitigation or waiver, and limits on who may be invoiced. Parts of it have since been litigated, a fair signal that this layer is still settling.
An import machine, by design
U.S. container traffic by direction, share of loaded TEUs, 2022
Source: Bureau of Transportation Statistics, Port Performance Freight Statistics: 2025 Annual Report
That lopsidedness — 66% imports against 24% exports in 2022 — creates the port's quiet second problem: empties. Boxes arrive full and leave the country empty far more often than the reverse, so terminals must also store, sort, and repatriate steel nobody is paying to move. When a terminal is described as "full," empties are frequently a large share of what's filling it.
The gate
To leave by road, a container needs a chassis — the wheeled frame it rides on. Chassis were historically supplied by the ocean carriers and are now largely held in shared pools, which fixed one problem and created another: a chassis pool is only as useful as its worst-stocked location. A cleared, paid-for, ready container with no chassis under it is stuck, and the demurrage clock does not care why.
The truck that takes it is doing drayage — short-haul, port-to-warehouse work, usually appointment-based and often run by owner-operators. It is a low-margin, high-variance business, and its capacity is what converts a good day at the crane into a good day at the distribution center. From there the box is inside the world of regional warehouses and parcel networks, the same machinery that Amazon's delivery operation runs on.
The alternative is to skip the truck. On-dock rail loads containers onto double-stack trains inside the terminal itself: at the Port of Los Angeles that means five on-dock rail yards and more than 65 miles of track, with about 26% of all cargo and roughly 35% of intermodal containers moving out that way. By the port's own arithmetic, an average 30-car double-stack train removes something like 400 truck trips. Those trains reach the national network through the Alameda Corridor, a $2.4 billion, 20-mile below-grade freight line that eliminated more than 200 at-grade crossings and is built for up to 150 trains a day — a useful illustration that "port capacity" is usually decided several miles inland.
What ports actually do to prices
Now the question the whole trip is for. Ocean transport is a modest slice of what you pay at the register, so the effect of shipping costs on shelf prices is real but smaller than the coverage suggests — and it fades. Research published by the Federal Reserve Bank of Boston in 2024 estimated that in the post-2020 period, a 1% increase in shipping costs raised U.S. import prices by a bit more than 0.01%, peaking two to three months later and weakening over the following three.
A tiny elasticity multiplied by enormous swings still shows up, though. The same work attributes about 0.24 percentage points of monthly U.S. import price inflation to the 572% shipping cost surge between December 2019 and December 2021, and about 0.34 percentage points to the roughly 250% surge over the first seven months of 2024. Pass-through was strongest for goods with few alternative shipping routes — a reminder that what transmits a shock isn't the cost itself but the absence of a detour.
Most of the ships sail together
Share of U.S. containerized trade carried, alliance members vs. largest independent carrier, FY 2024 (%)
Source: Federal Maritime Commission, 63rd Annual Report, Fiscal Year 2024
Which brings up the market structure behind the berth window. Container lines operate in alliances — vessel-sharing agreements, filed with and monitored by the Federal Maritime Commission, under which competitors put ships into a common rotation and sell space on each other's vessels. For fiscal year 2024 the FMC reported that alliance carriers accounted for 89% of transpacific imports and 95% of transpacific exports, with the largest carrier outside any alliance at 5% and 3%. Membership reshuffles — the groupings were substantially rearranged in 2025 — so treat any particular roster as perishable and the concentration as the durable fact.
Alliances are defended as the reason a mid-sized U.S. port gets weekly service at all: pooling ships fills them and multiplies sailings. They're criticized on the grounds that shared capacity decisions across most of a trade lane look uncomfortably like coordinated supply. Both can be true at once, which is why the arrangement is regulated rather than banned — the FMC had 360 agreements on file at the end of FY 2024 and watched about 50 closely for competitive concerns.
How to read the next port story
The genuinely contested questions at U.S. ports are about who bears cost. Automation — software-driven cranes and yard equipment — raises throughput per acre while reducing dockside jobs, and longshore unions and terminal operators have bargained over that trade-off for decades; neither "more boxes per hour" nor "these are the last well-paid blue-collar port jobs" is a manufactured concern. Dredging and landside connections run into billions of public dollars per project, with benefits landing partly on the cities that host the truck traffic and partly on consumers nationwide who never see it.
The mechanics give you a way to place any of it. When something goes wrong at a port it is almost always one of three constraints, and they aren't interchangeable: water-side (not enough berth hours or crane moves for the ships that showed up), yard-side (the stack is too full, or chassis aren't where the boxes are), or land-side (drayage, rail slots, and warehouse space can't absorb what the cranes produce). Adding cranes doesn't fix a warehouse shortage. Building warehouses doesn't deepen a channel.
Primary Sources
- Bureau of Transportation Statistics, Port Performance Freight Statistics 2025 Annual Report
- Federal Maritime Commission, Detention and Demurrage
- Federal Maritime Commission, 63rd Annual Report, Fiscal Year 2024
- U.S. Customs and Border Protection, Importer Security Filing "10+2"
- Federal Reserve Bank of Boston, The Impact of Global Shipping Cost Surges on US Import Price Inflation (2024)
- Port of Los Angeles, Rail and on-dock intermodal operations
Keep explaining: related from the desk
How Amazon Delivery Actually Works
The box on your porch is the last step of a machine built from eight regional networks, robotic warehouses, a private trucking layer, and thousands of small delivery companies wearing Amazon's colors. Here's the whole run, from stow to doorstep.
Why Grocery Prices Don't Come Back Down
Inflation cooling doesn't mean prices fall — it means they climb slower. Here's the machinery that makes grocery prices a one-way ratchet, from sticky wages to the 11.8-cent farm share.
The Interstate Highway System
It's 1.2% of American road miles carrying about a quarter of all driving. Here's the machine behind the interstates — the 90/10 funding deal, the Highway Trust Fund, and how one 1956 law rearranged where Americans live, shop, and work.