How Weather Forecasts Are Made: From Balloon to Phone Notification
Twice a day, at the same synchronized moment worldwide, hundreds of balloons rise into the sky so a supercomputer can solve physics equations about tomorrow. The full pipeline behind your weather app - and why the ten-day forecast will always wobble.
Evergreen explainer, checked against the primary sources listed below. Full disclaimer
On this page4 sections
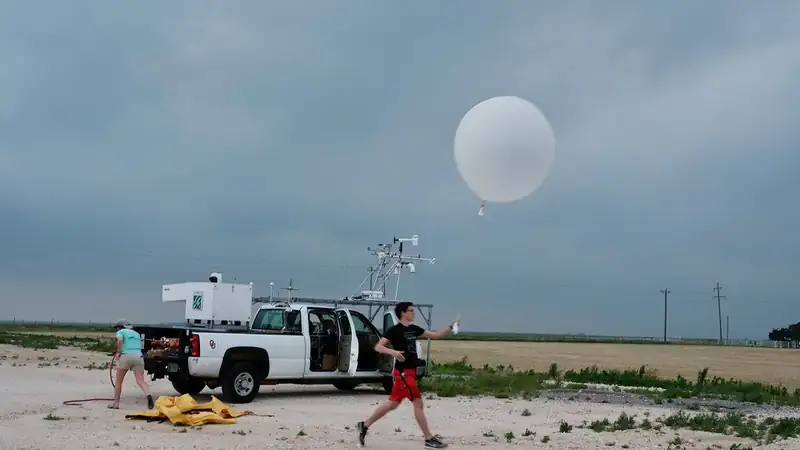
At the same two instants every day — midnight and noon Greenwich time, whatever the local clock says — technicians at hundreds of stations around the planet walk outside and release hydrogen- or helium-filled balloons. Over the next two hours each balloon climbs past 100,000 feet, its dangling instrument package radioing back temperature, humidity, pressure, and winds, until the balloon bursts and a small parachute brings the electronics down in a field somewhere. In the United States alone this happens at 92 National Weather Service stations, twice daily, every day of the year, per the agency's upper-air program.
It looks, from the parking lot, like an oddly solemn science-fair ritual performed by federal employees. It is actually step one of the machine that produces the forecast on your phone — a machine that runs through physics engines on supercomputers, human meteorologists in 122 offices, and a distribution system that ends with your pocket buzzing about a tornado. Walk the entire pipeline end to end, balloon to buzz, and you will never read a "70% chance of rain" quite the same way again.
Step one: measure the entire atmosphere, constantly
A weather forecast is a prediction of a fluid — the atmosphere — obeying knowable physical laws. But physics can only run forward from a starting point: to compute tomorrow's atmosphere you must first know today's, everywhere, in three dimensions. That's the observation problem, and its scale is the least appreciated fact in meteorology. The National Weather Service collects and analyzes more than 6.3 billion observations per day, per its own service description, flowing from:
- Satellites — the workhorses, imaging clouds, moisture, and temperature profiles globally (the majority of all data by volume);
- The balloon network — those synchronized radiosonde launches, still the gold-standard direct measurement of the atmosphere's vertical structure;
- Radar — the NEXRAD Doppler network of over a hundred stations, watching precipitation and wind inside storms; its dual-polarization upgrade even distinguishes rain from hail from flying tornado debris, the grim signature forecasters call a "debris ball";
- Aircraft — thousands of commercial flights report conditions along their routes, effectively a second balloon network;
- Surface stations, ocean buoys, and ships filling in the bottom layer.
Why the synchronized launch times? Because the models need a single global snapshot, not a smear of measurements taken whenever convenient. Everyone launches at 00Z and 12Z — Greenwich time being the one clock no local daylight-saving law can touch.
Step two: physics on a supercomputer
All of it pours into numerical weather prediction — the discipline of slicing the atmosphere into a three-dimensional grid and using the equations of fluid dynamics and thermodynamics to step it forward in time. First comes data assimilation: blending billions of imperfect, scattered observations into one coherent starting state (mathematically the hardest part of the whole enterprise). Then the simulation runs.
NOAA's flagship, the Global Forecast System (GFS), models the entire planet out to 16 days, four times daily. Around it sits a fleet of specialists: short-range, high-resolution models that resolve individual thunderstorms over the U.S. hour by hour; hurricane models; ocean-wave models. Other nations run rivals — the European center's global model is the GFS's famous benchmark competitor, and forecasters routinely compare them ("the Euro has it further east") the way analysts compare polls.
A note on what these models are not: they aren't looking up similar past weather, and they aren't extrapolating trends. They are solving, over and over across millions of grid cells, the same equations a physicist would use for any fluid — conservation of mass, momentum, and energy, plus the thermodynamics of water changing phase. That's why weather prediction consumes some of the largest civilian supercomputers on Earth, and why every generation of faster hardware buys finer grids, better-resolved storms, and a little more usable lead time.
The catch is the one Edward Lorenz discovered in 1963: the atmosphere is chaotic. Tiny errors in the starting snapshot grow exponentially, which imposes a hard horizon — beyond roughly two weeks, day-by-day detail is mathematically unrecoverable no matter how good the computers get. Meteorology's answer is the ensemble: run the model dozens of times with slightly perturbed starting conditions and see how much the copies disagree. When they cluster, confidence is high; when they splay, the forecast honestly wobbles. That "70% chance of rain" is the machine quantifying its own uncertainty — probability isn't a hedge, it's the product.
Step three: humans, warnings, and the last mile to your phone
The model output then lands on the desks of meteorologists at the NWS's 122 Weather Forecast Offices, each owning a patch of the country. Their job is judgment at the margins: reconciling disagreeing models, adjusting for local terrain quirks no global grid resolves, and — above all — deciding when to pull the warning lever. The system issues about 1.5 million forecasts and 50,000 warnings a year, and the warnings are where minutes matter: a tornado warning is a human forecaster reading live radar and choosing to trigger the sirens-and-cellphones machinery (Wireless Emergency Alerts ride the same federal alerting pipeline as AMBER alerts, blasting every phone in a warned polygon).
And your weather app? With rare exceptions, it's a presentation layer sitting on public data. U.S. taxpayer-funded observations, models, and forecasts are free and open by policy; private companies — from TV stations to app developers to firms selling routing weather to logistics networks — add interpolation, interface, and tailoring. It's one of the cleanest examples in American life of a public data utility with a private retail layer on top. (Where exactly the government-private boundary should sit is a perennial policy skirmish — proposals to narrow public forecasting surface regularly and are contested fiercely; we simply note the current architecture.)
The forecast pipeline, balloon to buzz
How an observation becomes the notification in your pocket
Diagram: The Explainer Desk. Source: National Weather Service program descriptions. NWS, forecasts and services
Is it actually getting better? Measurably, yes
Forecasting is one of the few prediction industries that rigorously scores itself in public, and the scores are a quiet triumph. The cleanest yardstick is hurricane track forecasting, where the National Hurricane Center publishes an annual verification of its own misses. Per the 2024 report: official track errors are up to 75% smaller than a few decades ago, with errors at the 4- and 5-day ranges falling 60–70% in just the past twenty years. In 2024 — a record-accuracy year at every lead time — the average 72-hour track miss was about 67 nautical miles; the average 24-hour miss, 28.
How far off a hurricane track forecast runs
NHC average Atlantic track error by lead time, 2024 (record year) — nautical miles
Source: National Hurricane Center, Forecast Verification Report 2024
Intensity forecasting — how strong the hurricane will be at landfall — lagged track skill for decades, because strength hinges on small-scale processes in the storm's core that coarse global grids can't see; specialized high-resolution hurricane models and reconnaissance aircraft flying directly into the eye have finally bent that curve too, though it remains the harder problem. The same trend runs through everyday forecasting: today's five-day forecast performs roughly as well as a three-day forecast did in the 1990s, a gain built from better satellites, better assimilation math, faster computers, and — lately — machine-learning models that NOAA and others now run alongside the physics engines as a new kind of ensemble member. Each day of gained lead time is bought with billions of observations and decades of incremental engineering, and each converts directly into evacuations ordered earlier, supply chains rerouted around freezes, and flights canceled before you drive to the airport.
So the honest way to read your app: the seven-day outlook is a physics simulation's confident middle; the ten-day is an ensemble shrugging in slow motion; and the buzz that interrupts dinner is a human being in one of 122 offices, watching a radar loop, deciding your neighborhood needs to know right now. The balloon that made it possible went up this morning, on schedule, at the exact moment as every other balloon on Earth — and its replacement is already inflated for tonight.
Primary Sources
Keep explaining: related from the desk
Daylight Saving Time: Why It's So Hard to Kill
Twice a year America argues about the clocks, and nothing changes. The machinery behind that stalemate — a 1966 federal law, a lopsided opt-out rule, an energy rationale that mostly evaporated, and the one time we tried permanence and hated it.
How Amazon Delivery Actually Works
The box on your porch is the last step of a machine built from eight regional networks, robotic warehouses, a private trucking layer, and thousands of small delivery companies wearing Amazon's colors. Here's the whole run, from stow to doorstep.

Why Eggs? America's Most Volatile Grocery Price
Most grocery prices ratchet up and stay. Egg prices rocket, crash, and rocket again. The reason is biology meeting industrial structure — a supply chain where one virus in one barn can erase millions of layers overnight, and rebuilding takes months.